Photo by ThisisEngineering RAEng on Unsplash
SYSTEMS FAILURES AND SYSTEM RELIABILITY
The meaning of the term ‘system’
A system is something that as a whole is made up of many parts.
The principles of system failure analysis
A systems failure occurs when a system does not meet its requirements A systems failure analysis is an investigation to determine the underlying reasons for the non-conformance to system requirements. A systems failure analysis is performed to identify non-conformance root causes and to recommend appropriate corrective action. It can be classed as the process of collecting and analysing data associated with a system to determine the cause or causes of failure.
Holistic and reductionist approaches
A holistic approach to failure analysis is based on the theory that certain wholes are to be regarded as greater than the sum of their parts, and that looking at the system is more valuable than detailing the components and analysing each element.
A reductionist approach is based on the principle of analysing complex systems into single constituents or following the principle that a system can be fully understood in terms of its isolated parts, or an idea understood in terms of simple concepts.
Using calculations in the assessment of system reliability
Calculations can be used in reliability theory to examine a system with many components to calculate its overall reliability and the probability the system will work and continue to keep working. Systems can be modelled in a variety of structures such as; Parallel, series or a combination of both – Mixed.
Let’s take a look:
Parallel
A parallel system will work if one of the components is working as it is side by side operations.

In this type of operation, a failure of component A or B would not affect the overall system, however, if both components failed, this would mean the system would not be able to operate.
Let us refer to the reliability of the system as “R”. if we look at the diagram we can calculate as follows;
R = 1 – (1-RA) (1 – RB)
Series
For a system in series to be successful, each component should function correctly. A failure of any one of the components would result in complete failure of the whole system.
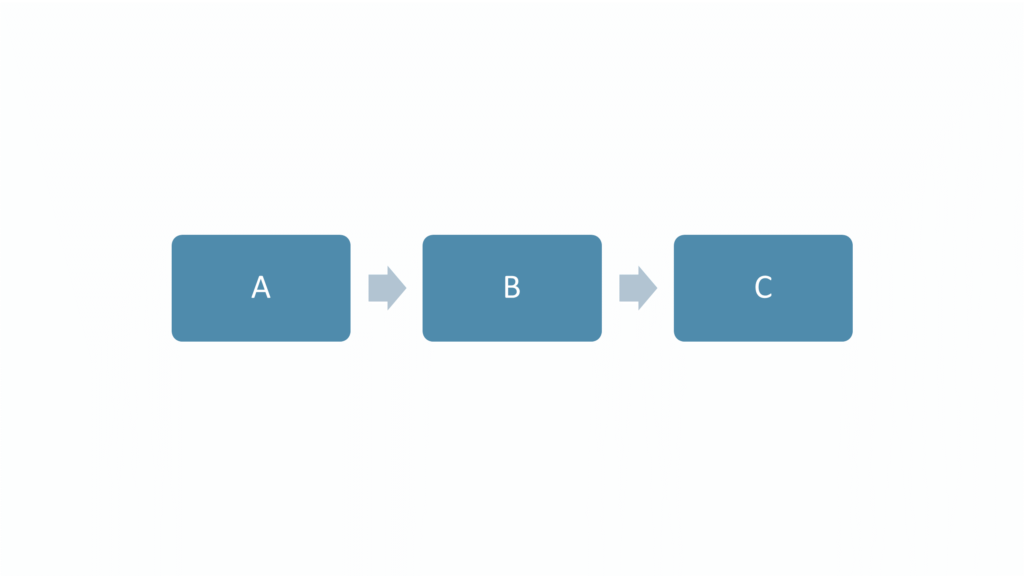
Considering the above diagram let us consider A, B and C as components in series. We can calculate reliability as;
R = RA x RB x RC
Mixed systems
Mixed systems can combine the use of both parallel and series components structures.
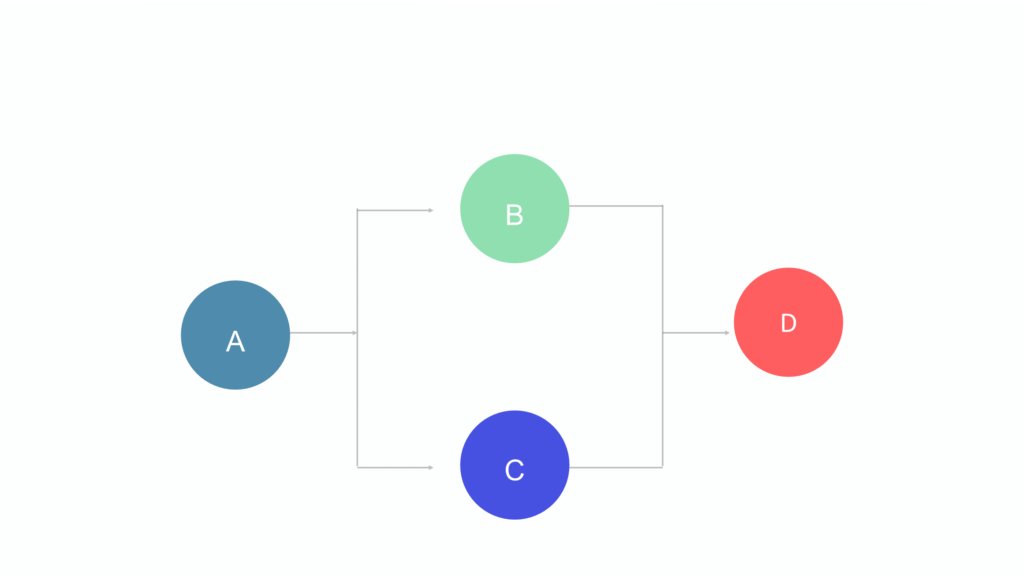
In the diagram above of a mixed system, failure can be caused through components A or B and C, or D.
A failure of either B or C alone would not lead to a complete failure of the system.
METHODS FOR IMPROVING SYSTEM RELIABILITY
The reliability of any system can be significantly improved in several ways. This largely can be dependent on using reliable components are continuously developed to improve their reliability. This can be achieved by using quality control and quality assurance in the design and manufacture of components. There are also several other ways to improve a system, such as:
Standby systems
A standby system is when an identical critical system is provided alongside the main system which remains in standby mode. In the event of failure of the primary system, the standby system would be activated to ensure continuous operation.
Minimising failures to danger
The term failure to danger is given to component failure where the failure mode causes a dangerous event or situation. A good example would be the failure of an interlocking component on a machine. The interlock is designed to have a failure mode that would prevent the machine from operating. However, should this fail and the machine still operate this would create a “dangerous” situation.
Planned preventive maintenance (PPM)
Planned preventive maintenance is the maintenance that consists of planned interventions that are considered to prolong the life of equipment and/or a component. Such maintenance would consist of an inspection or service of components/parts whereby some components would be required to be replaced or serviced at set intervals. This can greatly improve the reliability and indeed the longevity and service life and safety of the system.
Minimising human error
Human error is certainly influential on a systems reliability. It can be said that by influencing human behaviours and minimising human error we could assure system reliability.
FAILURE TRACING METHODOLOGIES
We must be able to trace failure in order to identify the root causes and to see what can be done to prevent recurrence in the future. This can be done both proactively (as a study) or reactively (as an investigative process). Next, we will look at some of the more complex failure tracing methods used in the industry.
Hazard and operability studies (HAZOP)
HAZOP (hazard and operability) are procedural tools used to highlight the downfalls and weak spots in the operation and design of industrial plants, which if they were to occur, could potentially effect the plant’s ability to achieve productivity safely. It was developed by Imperial Chemical Industries for improving the safety of their chemical plants.
The procedure proved to be so successful that it gained acceptance within industry as a useful tool for qualitative hazard analysis. The technique is now widely used as a standard procedure for safety assessment in the process, chemical, petroleum industries and many others.
The principle of reasonable practicability means to assess risk, and proportion new measures of control to such assessments. This has led to a methodology of quantified risk assessment which is an important element in producing a balanced decision on the precautions to be applied to reduce the components of the overall risk, particularly where major hazards are concerned, and for prioritising or targeting control measures.
There are different types of HAZOP:
- Process – to assess plant and process systems
- Procedure – review of procedures or operational sequences
- Software – to identify
Fault tree analysis (FTA)
Fault Tree analysis is a deductive reasoning method (from generic to specific information) for determining the causes of an incident.
A Fault Tree is a vertical graphic model that displays the various combinations of unwanted events that can result in an incident. The diagram represents the interaction of these failures and events within a system. Fault Tree diagrams are logic block diagrams that display the state of a system (Top Event) in terms of the states of its components (basic events). A Fault Tree diagram is built top-down starting with the Top Event (the overall system) and going backwards in time from there. It shows the pathways from this Top Event that can lead to other foreseeable, undesirable basic events. Each event is analysed by asking, “How could this happen?” The pathways interconnect contributory events and conditions, using gate symbols (AND, OR). AND gates represent a condition in which all the events shown below the gate must be present for the event shown above the gate to occur. An OR gate represents a situation in which any of the events shown below the gate can lead to the event shown above the gate.
FTA analysis is mainly used in the fields of safety engineering and reliability engineering mainly to:
- Understanding how systems can fail
- Identifying the best ways to reduce risk
- Determine or get an idea of event rates of a safety accident.
This method is mostly used in high hazard industries such as: Nuclear power, chemical and process, petrochemical and pharmaceutical.
FTA analysis involves five steps:
- Define the undesired event to study
It can difficult to define the undesired event, although some are easy to identify. An engineer with knowledge of a system for example will be a good person to help define and number the undesired events. These events can then be used to create the FTA.
- Obtain an understanding of the system
Once the undesired event is selected, all causes with probabilities of affecting the undesired event of 0 or more are studied and analysed. Getting exact numbers for the probabilities leading to the event is usually impossible as it may be very costly and time consuming to do so. Computer software is used to study probabilities. For the event, all causes are then numbered and sequenced in the order of occurrence and then are used for the next step, constructing the fault tree.
- Construct the fault tree
After selecting the undesired event and having analysed the system so that all the causing effects are known (and if possible their probabilities) the fault tree can then be constructed based on AND and OR gates which define the main characteristics.
- Evaluate the fault tree
After the fault tree is created, it is evaluated and analysed for any improvement. The final step is to control the hazards identified.
- Control the hazards identified
After identifying the hazards, all possible methods are pursued to decrease the probability of occurrence.

Event tree analysis (ETA)
Event tree analysis is a forward-thinking process, based on binary logic, in which an event either has or has not happened or a component has or has not failed.
An event tree begins with an initiating event, such as component failure, increase in temperature/pressure or a release of a hazardous substance. Possible outcomes can be calculated for probability of occurrence through following an event through different pathways.
Procedures for Performing Event Tree Analysis
Four steps are necessary to perform ETA:
Step 1 Identify an initiating event of interest.
Step 2 Identify the safety functions designed to deal with the initiating event.
The safety functions (safety systems, procedures, operator actions, etc.) that respond to the initiating event can be thought of as the plant’s defence against the occurrence of the initiating event. These safety functions usually include:
Safe systems that automatically respond to the initiating event, such as automatic shutdown systems.
Alarms that alert the operator when the initiating event occurs.
Operator actions.
The analyst should identify all system functions and their intended purpose for mitigating the effects of the initiating event. The analyst should list the safety functions in the order in which they are intended to occur.
Step 3 Construct the event tree. The event tree displays the logical progression of an accident. The event tree begins with the initiating event and proceeds through the successes and / or failures of the safety functions that react to the initiating event. Only two possibilities are considered when evaluating the response of the safety functions, that it is a success or a failure. The success of a safety function is defined as its ability to prevent the initiating event from progressing further, thus preventing an accident. The failure of a safety function is defined as its inability to stop the progression of an initiating event or alter its course so that the other safety functions can respond to it.
Step 4 Describe the resulting accident event sequences. The accident event sequences represent a multitude of incidents that can result from the initiating event. One or more of the sequences may represent in an accident. The analyst defines the successes and failures in each resulting sequence and compiles a description of its expected outcome.
The analyst then ranks the accidents based on the severity of their outcomes. If enough data is available, the analyst can use probabilistic analysis to estimate accident probabilities from event probabilities, and thus obtain additional information for ranking the accidents. The structure of the event tree should clearly show the development of the accident and help the analyst to define locations and establish priorities where additional safety features might be installed to either prevent these accidents or mitigate their effects
SCENARIO
One of the first things that I do as a practitioner joining any organisation is to undertake risk assessments. I have used many different forms of assessment such as; Dynamic, Task based, General and specific assessments, each with very similar functions. I always refer to the legal requirements first when undertaking such an assessment as this provides guidance on what controls should be considered. Within an organisational context, I would never undertake a desktop only risk assessment on my own (although many companies may try and get you to do this!). I always involve the workforce as this creates a sense of ownership and allows me to gain valuable information at a grass roots level about the potential risks associated with the activity being assessed.
I have also used many methodologies for assessment using different models and matrix for assessment, however, all end up with the same output, a means to manage a risk!
TOP TIPS & KEY POINTS
Always involve the workforce in the development of risk assessments, consultation is key
Use the 5 steps to risk assessment
Mike Watson SVT Ltd
Darren Platts